Data: City of Bloomington Trash Collection: Difference between revisions
(Created new page for trash collection as an example of a data page.) |
|||
| Line 1: | Line 1: | ||
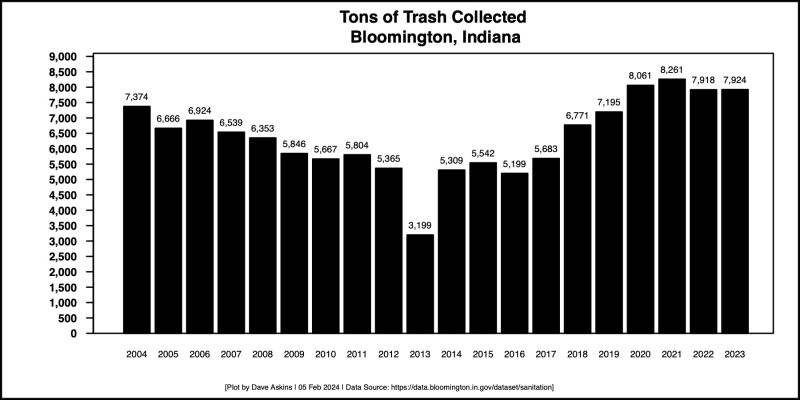
[[File: | [[File:City_of_Bloomington_Trash_Tons_from_2004_through_2023.jpg|alt=This is a bar chart with tonnages of trash plotted along the Y axis and years along the X axis. The years go from 2004 through 2023.|800x800px]] | ||
Among the datasets available on the city of [https://data.bloomington.in.gov/ Bloomington's B Clear Portal] is one containing the [https://data.bloomington.in.gov/browse?q=sanitation annual statistics for the city's sanitation division]. That data set includes one for the tons of trash collected each year. Here's a link to a .tsv file of the entire dataset: [https://bloomdocs.org/wp-content/uploads/simple-file-list/2024-02-05-Statistics-for-2004-2013-Downloaded-from-BClear-Sanitation-Division-Annual-Statistics-20240205.tsv 2024-02-05 Statistics for 2004-2013 Downloaded from BClear Sanitation_Division_Annual_Statistics_20240205.tsv] | |||
[[Category:Data]] | |||
Latest revision as of 09:13, 5 February 2024
Among the datasets available on the city of Bloomington's B Clear Portal is one containing the annual statistics for the city's sanitation division. That data set includes one for the tons of trash collected each year. Here's a link to a .tsv file of the entire dataset: 2024-02-05 Statistics for 2004-2013 Downloaded from BClear Sanitation_Division_Annual_Statistics_20240205.tsv
